Cohort lifecycle impact
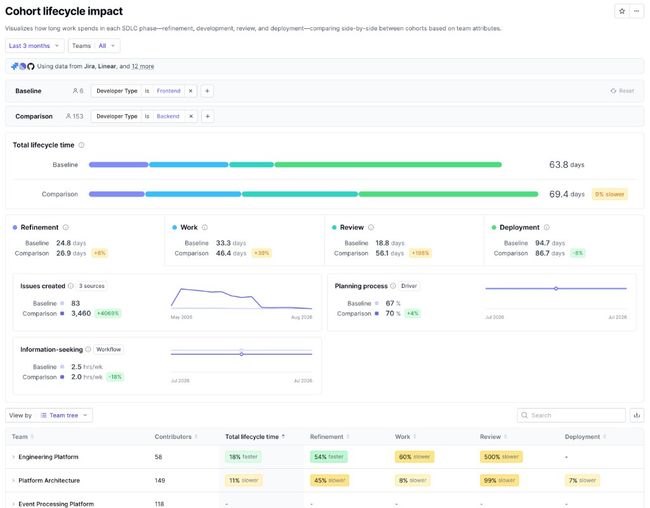
The Cohort lifecycle impact report compares how long work spends in each phase of the software development lifecycle (SDLC) between a baseline and a comparison cohort. Use this report to identify where a tool, process, or organizational characteristic is associated with faster delivery or additional friction.
Note: Cohort lifecycle impact requires Data Cloud, a Jira or Linear connection, and a supported source code management connection. The Deployment phase appears only when deployment data is available.
When to use cohort lifecycle impact
Cohort lifecycle impact answers the question: Where does delivery time differ between two attribute-defined groups?
This report helps teams:
- Compare lifecycle performance — See whether one cohort moves through the SDLC faster or slower than another.
- Locate differences by phase — Identify whether the largest differences occur during refinement, work, review, or deployment.
- Evaluate changes across groups — Compare teams that use a tool or process with teams that do not.
- Add context to lifecycle differences — Review related system and Snapshot metrics alongside each phase.
Differences between cohorts can have causes unrelated to the selected attributes. Use the report to find associations that need further investigation, not as evidence that an attribute caused a change.
Defining cohorts
The report compares two cohorts:
- Baseline is the reference group. It defaults to All attributes across all users, but you can customize it.
- Comparison is the group measured against the baseline. Report values remain N/A until you select at least one attribute.
You can define either cohort with one or more attribute groups. Within an attribute group, select is or is any of to include values and is not or is none of to exclude them. Selections from different attribute groups are combined, so cohort members must match every selected group.
The date and team or group filters at the top of the report apply to both cohorts.
How lifecycle time is calculated
DX includes issues created during the selected date range that have at least one measured phase with a positive duration. Each value is the average across qualifying issues in the cohort:
- Total lifecycle time runs from the earlier of issue creation or the first commit to the later of the last merge or last deployment.
- Refinement runs from issue creation to the first commit.
- Work runs from the first commit to the last commit.
- Review runs from the first review to the last merge.
- Deployment runs from the last merge to the last deployment.
DX excludes phase durations that are zero or negative. Phase windows can overlap, so total lifecycle time is not the sum of the phase averages.
The percentage change for each lifecycle value is calculated as:
(Comparison average - Baseline average) ÷ Baseline average × 100
A negative change means the comparison cohort is faster than the baseline. A positive change means it is slower.
Understanding the phase tabs
Each phase tab shows the baseline average, comparison average, and percentage change. It also pairs the lifecycle duration with related system and Snapshot metrics, such as issue volume, pull request size, review turnaround, or deployment frequency.
Available metrics depend on your connected data sources, enabled product capabilities, and configured Snapshot questions. Source labels identify whether a metric comes from a connected system, a Snapshot driver, or a Snapshot workflow.
Breaking down cohort differences
The breakdown table shows the percentage change in total lifecycle time and each available phase. Use the aggregation selector to compare results by team, group, user, or attribute, then expand rows to investigate where a cohort-level difference is concentrated. You can also download the table as a CSV.
How cohort lifecycle impact differs from related reports
- Cohort analysis compares a broader set of engineering metrics across a baseline and up to three cohorts. It does not show an end-to-end lifecycle view.
- Lifecycle by phase shows lifecycle duration and individual issue details without comparing cohorts.
- AI impact includes a Lifecycle impact tab focused on cohorts defined by AI usage. Cohort lifecycle impact supports any available user attributes.
Use cohort lifecycle impact to compare phase-level delivery performance across two attribute-based groups, Cohort analysis for a broader metric comparison, and Lifecycle by phase to inspect individual issues.